Email homework, answers or questions about the course to: lee.hardcastle@croftonacademy.org.uk

Saturday, 31 January 2009

****MOCK EXAM 2011 INFO****

You must revise the following in preparation for the mock exam:

All pupils (Foundation and Higher) must answer 3 questions. Each question should take 30 mins. You can only answer certain question combinations - read below:
 
You must answer either
Question 1 (Population)
or
Question 2 (Settlement)

Question 1: For the population question
1. Population pyramids
2. Development indicators such as life expectancy and how these change between countries
3. Ageing population and the consequences for a country
4. CASE STUDY - China One Child Policy. Why it was needed, how it has been introduced and what is the impact?


Question 2: For the settlement question
1. Rural to urban migration - why?
2. Shanty town locations
3. Shanty town problems
4. Counter-urbanisation - consequences of
5. CASE STUDY - Meadowhall (from steel to retail). What it was before, why it changed and its impact


You must answer either
Question 3 (Natural Hazard - climatic)
or
Question 4 (Natural Hazard - tectonic)

Question 3: For the climatic question
1. What is drought? impact of drought on countries?
2. Methods to overcome drought and how sustainable they are e.g. Groundwater supply water pump and rain water storage tank
3. CASE STUDY - climatic hazard e.g. Hurricane Katrina or Drought in Sahel (cause and effect and preparation success) 


Question 4: For the tectonic question
1. Predicting a volcanic eruption
2. Movement of plates at a boundary (draw and label)
3. Why do people live in dangerous areas?
4. CASE STUDY - tectonic hazard e.g. Pakistan earthquake or Montserrat eruption (Cause, effects and success of attempts to reduce impact)


You must answer either
Question 5 (Economic development)
or
Question 6 (Economic development - Aid)

Question 5: For the economic development question
1. Brandt line
2. Multinational companies
3. Reasons for industrial location
4. Factories impact on local economy
5. CASE STUDY - Mining in the Amazon Rainforest (Carajas Iron ore mine)


Question 6: For the economic development - aid question
1. GDP
2. Brandt line
3. Rich north MEDC against poor south LEDC - is this still true?
4. Development indicators e.g. literacy rates
5. Problems associated with aid
6. CASE STUDY - Aid project in a LEDC - Goat aid to Tanzania

General Information: Exam Paper Structure

June Exam Paper Structure (Foundation and Higher Tier)

This question paper has three sections; you must answer three questions, one from each section:

Section A: candidates answer either Question 1 (Population) or Question 2 (Settlement)
Section B: candidates answer either Question 3 (Tectonic) or Question 4 (Climatic)
Section C: candidates answer either Question 5 (Development) or Question 6 (Development)

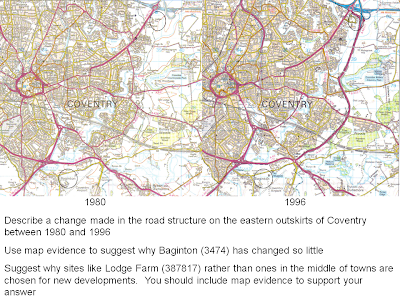
There is a separate Resource Booklet that will contain Ordnance survey maps, diagrams and cartoons.

The Exam Paper covers three themes. The themes and key investigation questions are listed below. During the GCSE Geography course you have been answering the key investigation questions.

Theme 2:
Population:
• How and why are there variations between the population structures of countries?

• What are the causes and consequences of natural population change over time?

• Why does migration occur and what are its effects?

Settlement:
• How is the pattern of land use within cities changing?

• What affects the provision of goods and retail services in rural and urban settlements?

Theme 3:
Natural Hazards:
• What is the global distribution of different types of natural hazard?

• What natural processes cause different types of natural hazards?

• How do natural hazards affect people and places in parts of the world with different levels of development?

• How can human activities affect the impact of natural hazards?

• How can people and places be protected from the impact of natural hazards?


Theme 4:
Economic Development:
• What is meant by "development"?

• How and why are there variations between the employment structures of different countries?

• What determines the location of different economic activities?

• How do multinational companies affect development?

• How can economic activity affect the physical environment at a variety of scales including global.

Controlled Assessment Conclusion & Evaluation Page

Thursday, 29 January 2009

General Information: Command Words

Command Words

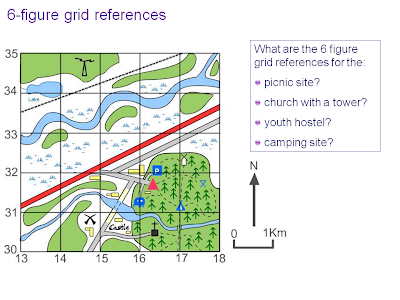
When completing your GCSE Geography exam you must read the question carefully and answer it in the right way to make sure that you get as many marks as possible. Always use geographical terms in your answers e.g. compass directions, use the scale of the map, give grid references.


Here are some of the command words that you may be given:

Annotate - add notes or labels to a map or diagram to explain what it shows.

Compare - look for ways in which features or places are similar or different. e.g. a city in an LEDC compared to a MEDC

Complete - add to a map or graph to finish it off.

Contrast - look for the differences between features or places. Often the question will ask you to compare and contrast.

Define - explain what something means e.g. freeze-thaw.

Describe - give details about what a map or diagram shows.

Discuss - usually wants a long answer, describing and giving reasons for or explaining arguments for and against.

Draw - a sketch map or diagram with labels to explain something.

Explain or account for - give reasons for the location or appearance of something.

Factors - reasons for the location of something such as a factory.

Give your ( or somebody else’s) views - say what you or a particular group think about something , for example should limestone quarries be allowed in the Peak District.

Identify - name, locate, recognise or select a particular feature or features, usually from a map, photo or diagram.

Mark - put onto a map or diagram.

Name, state, list - give accurate details or features.

Study - look carefully at a map, photo, table, diagram etc. and say what it shows.


With reference to /refer to examples you have studied - give specific details about your case studies.

With the help of/using the information provided - make sure you include examples from the information, including grid references if it is a map.

General Information: Picture and Map Questions

Look at how images, pictures and maps are used in the final exam


Monday, 19 January 2009

Theme 2: Population - General Revision

POPULATION

World pattern of population distribution
The world’s population distribution is divided into 3 main groups:
1. Areas of low density (less than 10 people per km2). Examples include Sahara Desert and Canada
2. Areas of medium density (10-50 people per km2). Examples include California, south-east Australia and the Nile Valley in Egypt
3. Areas of high density (above 50 people per km2). Examples include South and East Asia and Europe

The difference between density and distribution
- Population Distribution = the way people are spread out across the Earth’s surface
- Population Density = the number of people living within a given area (usually a square kilometre)

Reasons for different populations
Densely
populated areas are areas which have large numbers of people per km2. These are areas where there are many advantages for the people such as warmer climate, fertile soil and flat land.

Sparsely populated areas are areas which have small numbers of people per km2. These are areas where there are many disadvantages for the people such as extreme climates (too cold, too dry), infertile soil and lack of employment.

For example, the UK has densely populated areas in large cities and along good transport links, but sparsely populated areas along rugged coast lines and highland areas.

Also Brazil has densely populated regions close to large cities but sparsely populated regions in the tropical rainforest and areas which suffer drought.

World Population Growth
The population of the world grew very slowly up until about 1900. The population then exploded and increased rapidly and still continues today. The world’s population has continued to grow because the birth rate has remained higher than the death rate.

Birth rate and death rate
Birth rate is the amount of people who are born per 1000 of the population
Death rate is the amount of people who die per 1000 of the population

Demographic Transition Model
The Demographic Transition Model attempts to explain the cycles that a population can go through. It is based on what has happened in the United Kingdom.

Stage 1- This is where the birth rate is high and the death rate is high. The population remains stable at this point (very few countries are now at this stage)
Stage 2- This is where the birth rates are high but the death rates begin to fall. This results in the population increasing. Lots of countries in the developing world are at this stage, due to improved medical care, but poor education.
Stage 3- This is where the birth rate starts to fall. The growth of the population begins to slow down. Today many LEDC’s are at this stage as they are beginning to educate their people about birth control and more women are keen to go to work instead of having large families.
Stage 4- Low birth rate and low death rates. At this point the population total begins to stabilise and most MEDC’s are at this stage.
Stage 5?

It is thought that some MEDC countries are now going through a stage 5 where the population has begun to decline. This leads to an aging population as people are not dying due to good medical care, but babies are also not being born due to good access to contraception and a stronger desire amongst women to work. In some countries such as the UK, the death rate is now higher than the birth rate due to unhealthy diets, pollution and lack of exercise.

Contrasts between MEDC’’s and LEDC’s

- In many MEDC’s natural increase is low due to low birth rates and low death rates
- In LEDC’s there has been a massive population explosion due to high birth rates and lower death rates

Population Pyramids
The population pyramid of an MEDC would have a small bottom third, a larger middle and small top third
The population pyramid of an LEDC would have a large bottom third which gradually decreases in size towards the top


Migration
Migration is the movement of people from one area to another within a country (internal migration) or from one country to another country (international migration).

There are several reasons for why people may want to migrate.
These can be classified into push and pull factors.

PUSH FACTORS

Poverty
Drought and famine
Pressure on the land
Few jobs
Lack of services
Remoteness

Pull Factors

Better paid jobs in industry
Better schools and hospitals
Shops and entertainment
Water supply, electricity
Reliable food supplies
Improved housing

Migration can either be voluntary or forced.
Forced migration is when people have no choice but to move (for example due to war, disaster, famine)
Voluntary migration is when people choose to move to another country for a better life (for example, moving for a better education, employment, family)

Advantages/disadvantages of emigration/immigration to losing/host country
Advantage for the host country = Extra labour. May bring skills/money. Cultural exchange brings new skills and ideas.
Disadvantage for the host country =
A strain on the resources, especially in LEDC’s. Can lead to poor housing being built and poor medical care.
Advantages for the losing country = Reduces burden on the country as there are fewer people to provide for. Money is sent back to family members from host countries.
Disadvantages for the losing country = A loss of labour and skills

The social, economic and political effects of population change
Social
Pressure on land as more people move in. Conflicts of cultures from migrants can lead to civil wars. Pressure on medical systems and schools
Lack of skilled workers due to ageing populations. Pressure on medical system
Economic
Lack of money for services due to strain on government
Fewer people to work so higher taxes need to be paid to cover costs of pensions and medical care
Political
Government are not able to finance growing population or provide work for them so informal sector becomes dominant
Government forced to charge people more taxes to cover growing costs of an elderly population

Strategies for coping
MEDC’s
Advertising for workers from other countries to come and work in sparsely populated areas such as the Shetlands
Tax incentives for large families to increase birth rates in France
Banning contraceptives
Extending urban areas to encourage people to move away from densely populated cities in the Netherlands

LEDC’s
Indonesian transmigration policy whereby people are offered incentives to move to one of the sparsely populated islands
China’s one child policy whereby each couple are only allowed to have one child per household
Settlements being built away from over populated areas in Brazil

Summary
- The world’s population distribution is divided into 3 main groups
- Population Distribution- the way people are spread out across the Earth’s surface
- Population Density- the number of people who live within a given area (usually a square kilometre)
- Densely populated areas are areas which have large numbers of people per km2. These are areas where there are many advantages for the people such as warmer climate, fertile soil and flat land.
- Sparsely populated areas are areas which have small numbers of people per km2. These are areas where there are many disadvantages for the people such as extreme climates, infertile soil and lack of employment.
- Birth rate is the amount of people who are born per 1000 of the population
- Death rate is the amount of people who die per 1000 of the population
- Migration is the movement of people from one area to another.
- The Demographic Transition Model attempts to explain the cycles that a population can go through.

Theme 2: Population - UK Population Distribution


Case Study: UK Population Distribution


Facts:


1. Population in the UK is unevenly distributed (spread) for a variety of reasons.


2. Some places are crowded (densely populated).


3. Some places have few people (sparsely populated).


4. Some places have a population density in between densely and sparsely.


5. Places like cities/towns, ports, industrial centres and areas near major transport routes tend to be densely populated.


6. 10% of the UK population live on 30% of the UK land area in the north west highlands of Scotland, whereas 30% of the UK population live on just 10% of the UK land area in the south east of England! This makes the south east of England very crowded and the north west of Scotland very sparse.


Factors Affecting Population Density in the UK:


1. Flat land (Relief = height of the land)


2. Agriculture (farming)


3. Settlement location


4. Raw materials


5. Climate


6. Industry


7. Transport links and communication


8. Distance to markets (not Wakefield market, but the large population who would buy your goods)


North West Highlands of Scotland: sparsely populated (<20>

Why?

- harsh climate and environment (over 1800mm of rain per year/fewer sunshine hours) Atlantic and polar winds

- relief is mountainous - difficult to build, farm and travel

- lack of good transport links

- distance from other places - the distance would be a factor to discourage industry locating in this region

- poor farming conditions (poor soils, hilly relief). This results in a type of farming called Crofting (poor, subsistence farming where not much profit if any is made).


Norfolk: (20-100 people per km2)

Why?

- Less than average amounts of rainfall (1000-1800mm per year - enough for crop growing) and long sunshine hours. Warmer temperatures 16C average. Climate is an advantage for farming in this region

- flat land to build and farm on

- rich fertile soil

- short travelling distances (countryside location but people can commute daily into the big cities and towns of the south east, like London, on the motorway network)

- large nearby market to buy products from

- developed port industry

- developed tourist industry around the coast


Merseyside: (>100 people per Km2)

Why?

- flat land to build on

- Cities like Liverpool developed on the coast and River Mersey (trade/import and export)

- settlements and commuter areas developed where people lived and travelled in to work in the cities such as Liverpool

- port industry grew and associated industries close by to the ports developed

- market gardening farming conditions

- less harsh climate than north west highlands of Scotland, but more rain and slightly lower temperatures than Norfolk

- transport links (M62/M6 and rail developed). Government investment to develop the region


London: (>100 people per km2)

Why?

- Capital city

- Flat land to expand

- Location of Government and lots of Government investment

- Financial institutions

- Transport 'Hub' of the UK (rail, motorways, airports)

- Gateway to Europe

- Pre 1950 Worlds biggest port

- Fashion, retail, Arts

- Tourist

- One of the world's major cities (migrants attracted 'bright lights and opportunities')


Theme 2: Population - LEDC Population Distribution

Case Study 5: Population Distribution in a LEDC (Brazil)

This map shows the density (how crowded) of people in Brazil. Notice the purple colours (highest density) around the coast. The further west into Brazil you go the sparser the population density becomes.


Fact:
1. Brazil's population distribution is uneven.
2. 90% of the population live on a 500km strip of land along the south east coast.
South East Coast of Brazil:
(Sao Paulo / Rio de Janeiro area)
- densely populated (>100 people per km2)
- pleasant climate
- reliable rainfall
- fertile soils (1/2 world's coffee beans grown)
-available raw materials
- available energy supplies
- transport network and government investment
Amazon Rainforest:
- sparsely populated (<20>
- too hot, wet and humid / unhealthy living conditions
- dense forest makes travel, building and farming difficult
- poor soils / poor farming conditions
- far away from other areas
- lack of government investment (compared to other regions)
- Manaus (city in the rainforest located on the Amazon River = densely populated)
North East Coast:
(Recife / Salvador area)
- densely populated (>100 people per km2)
- Portuguese settlers arrived on this stretch of coastline
- natural harbours to import/export goods and trade
- reliable rainfall
- fertile soil
- good farming conditions


Theme 2: Population - MEDC Population Distribution

Japan Population Distribution:
an MEDC outside Europe


This is a population density map of Japan. The dark green represents the highest population density. As seen on the map most of the population is on the south coastline of Honshu island and around the Tokyo area. Population is the lowest in the north and on the northernmost island of Hokkaido.

The population in Japan is unevenly distributed.
Japan has 322 people per km2.
Tokyo has 5500 people per km2.
Central Tokyo has >20,000 people per km2.


Reasons for the population distribution:


1. Flat land - only 13% of land is flat enough to build on. This land is mostly around the coastal areas along the south east coast of Honshu island (87% of Japan is mountainous).


2. Deep water natural harbours along the south east coast provide shelter from tropical storms (Typhoons).


3. Warmer, drier climate to the south, harsher colder climate to the north. Hot summers and a long growing season in the south (more crops can be grown). Cool summers and shorter growing season in the north.


4. Richer, fertile soil to the south.

Theme 2: Population - Population Control

Case Study: China's One Child Policy - a way of controlling a growing population

General Facts:
By the end of 2003, China’s population stood at 1.29 billion, accounting for 21% of the world’s total population. Its family planning (one child) policy has been implemented since the end of the 1970s and has led to a reduction of 300 million births during the last thirty years, with the birth rate continuing to decline. In 2003, the net population increase was 7.7 million with a birth rate of 12.41‰ and a natural growth rate of 6.01‰, compared to an increase of 23 million persons per year at the end of the 1960s and early 1970s.
As a result of this birth-control policy, within 30 years the demographic characteristics have now changed from a “high birth rate, low death rate and high growth rate” to a “low birth rate, low death rate and low growth rate”, a transformation that took many developed countries nearly one century to complete.
However, this fast transformation has also led to disadvantages in the population structure, mainly in two respects – an ageing population and an imbalance in the sex ratio.

One Child Policy Background Information:
China's population went out of control in the 1950s and 1960s when the Chinese were encouraged to go and have as many children as possible to make China a 'great world leading nation'.

Hundreds of millions of extra children were born in a baby boom that sent the birth rate soaring to 5.8 children per couple, a level unsustainable by China's natural resources of food, water and energy.

Rules were then imposed on families to limit population growth. The rules were more complex than the simple instruction not to have more than one baby, although parents who comply with this still receive a certificate and a lump sum on retirement.

Two babies were permitted in many areas in the countryside, or if the first child was a female, since Chinese tradition strongly favours sons.

Breaking the one-child rule would result in a heavy fine, calculated as a multiple of salary in the year of the child's birth, or as a proportion of the collective income of the community in peasant areas. State officials who have more than one child automatically lose their jobs, a heavy punishment.

The rules are privately detested by many Chinese and have been criticised abroad. Human rights activists complain that the one-child policy has led to the practice of eugenics, and that the Chinese state uses it as a method of social engineering.
Some couples are given rigorous medical tests before they are allowed to marry, and it is claimed that people suffering from mental illnesses such as schizophrenia and disabilities including dyslexia are banned from marriage.

Chinese officials say that the one-child policy has been successful in preventing at least 300 million births, and has boosted prosperity.

Thirty years after the policy was imposed, China's actual birth rate is said to be not one child per couple but 1.8 children, because of exemptions and widespread flouting of the law by migrant peasants who travel to work in cities. But this is still below the level of 2.1 children needed to maintain population levels, and as such is starting to put pressure on state resources.
When the 1950/1960s enormous baby boom generation reaches retirement age in a few years, Chinese officials fear that their families will be unable to provide financial and social support.
One child being left to care for two parents and four grandparents is known as the "4-2-1" problem, and threatens to put severe strain on communities in a country which lacks a formal social security system to care for the elderly.

The policy has also produced an unnatural gender imbalance, as couples use legal and illegal means to ensure that their only child is a son. There are 117 men to each 100 women in China compared with the 108:100 imbalance in India, where sons are also preferred and female foetuses are sometimes aborted or baby girls left exposed to die.
Chinese officials estimate that by 2020 there will be 30 million men known as "bare branches", unable to find a wife to marry and have their own child.
Another consequence of the one-child rule has been the creation of a generation of "little emperors", indulged and cosseted boy children who are often overweight, arrogant and lacking in social skills.
In the cities, a new class of city worker has arisen with a Western-style reluctance to have more than one child, because they want to preserve their rising standard of living.
Although all Chinese feel that the one-child policy has been a good thing for their country, most say they personally wish they could have had more children.

Officials are said to fear that if the policy is simply lifted overnight, there will be a population explosion.

Theme 2: Population - World Population Distribution


World Population Distribution


(Where are people and why?)


The map above shows:


1. Deeper purple colour = densely populated (more than 100 people per km2)


2. Lighter green/yellow = sparsely populated (less than 20 people per km2)


3. Europe, South East Asia (densely populated regions)


Area 1: Brazil (Amazon) = sparsely populated (less than 20 people per km2) because:


- too hot and wet


- dense forest makes communication and building difficult


- isolated areas with lack of government investment


- poor soils


Area 2: Europe = densely populated (more than 100 people per km2) because:


- reliable rainfall spread evenly throughout the year


- no temperature extremes


- reservoirs to store water and clean drinking water


- good road and rail links


- energy sources and supplies


- mineral deposits


- low lying and gently sloping land ideal for farming and building


Area 3: India and China = densely populated (more than 100 people per km2) because:


- flat, extensive plains and low lying land


- rivers provide irrigation for crops


- Fertile soil along river flood plains and river deltas


- hot and wet climate ideal for agriculture


Area 4: Northeastern USA = densely populated (more than 100 people per km2) because:


- industrial centre and port centre (established)


- no climate extremes


- reliable communication and transport links


Theme 2: Population - International Migration

Case Studies - Migration - Mexico to the USA


Background Information:
-There is a 2000km border between USA and Mexico
-1 million+ Mexicans migrate to the USA every year
-Illegal migration is a huge problem for USA and Mexico
-US Border Patrol guard the border and try to prevent illegal immigrants
-850,000 were caught in 1995 and were deported


Push Factors
Poor medical facilities - 1800 people per doctor
Low paid jobs - (GNP = $3,750)
Adult literacy rates only 55% can read and write - poor education prospects
Life expectancy 72 yrs
40% are unemployed


Pull Factors
Excellent medical facilities - 400 people per doctor
Well paid jobs - GNP = $24,750)
Adult literacy rates 99% - good education prospects
Life expectancy 76 yrs
Many jobs available for low paid workers such as Mexicans


What are the impacts on the USA
-Illegal migration costs the USA millions of dollars for border patrols and prisons
-Mexicans are seen as a drain on the USA economy
-Migrant workers keep wages low which affects Americans
-They cause problems in cities due to cultural and racial issues
-Mexican migrants benefit the US economy by working for low wages
-Mexican culture has enriched the US border states with food, language and music
-The incidents of TB has been increasing greatly due to the increased migration


What are the impacts on Mexico?
-The Mexican countryside has a shortage of economically active people
-Many men emigrate leaving a majority of women who have trouble finding marriage partners
-Young people tend to migrate leaving the old and the very young
-Legal and illegal immigrants together send some $6 billion a year back to Mexico
-Certain villages have lost 2/3 of its inhabitants

Theme 2: Population Quick Questions

Quick Questions: Population

1.a) Under what circumstances does natural increase happen to a population?

b) Under what circumstances does natural decrease happen to a population?

2. What happens to death rate at Stage 2 of the DTM?

3. What happens to birth rate at Stage 3 of the DTM?

4. Are LEDCs or MEDCs more likely to be in the early stages of the DTM?

5. What is the population structure of a country?

6. What do population pyramids show?

7. Give one reason why birth rate is high during Stage 1 of the DTM.

8. Describe how changes in agriculture affect the population growth rate>

9. Give one reason why the birth rate falls rapidly during Stage 3 of the DTM.

10.Briefly describe the population structure of a country in Stage 5 of the DTM.

11.Give two social impacts and two environmental impacts of overpopulation.

12.Give one economic impact of a youthful population.

13.Give an example of a strategy a country could use to control overpopulation.

14.Describe what it means for a country to develop in a way that’s sustainable.

15.For a case study you know:

a) Describe a policy used to try to control overpopulation.

b) Give one piece of evidence that shows how effective this policy has been.

16.What is an ageing population?

17.What causes an ageing population?

18.Give one economic impact and one social impact of an ageing population.

19.Describe one strategy to cope with an ageing population.

20.a) Name a country that has an ageing population and describe what caused it.

b) For the country you’ve named, describe one problem caused by the ageing population.

c) Give one strategy used by the country to influence population change. Explain how it helps, and comment on its sustainability.

21. Define ‘migration’.

22. What is it called when a person moves into an area?

23. a) Explain what ‘push factors’ and ‘pull factors’ are in migration.

b) Give an example of a pull factor.

24. Give one negative impact of migration on the country of origin.

25. Give one positive impact of migration on the destination country.

26. Describe one way in which international migration can be managed.

27. a) Give one push factor and one pull factor to explain why people have emigrated to a country you have studied.

b) Give one impact of this migration on the country of origin and one on the destination country.

c) Describe a strategy the destination country uses to try to control international migration.

Sunday, 18 January 2009

Theme 2: Settlement - Retail

Case Study 6: The Meadowhall Story

Location:

  • Junction 34 of the M1 motorway

  • 3 miles north east of Sheffield City Centre

  • Don Valley area of Sheffield

  • Brownfield site (built on former steel works)

  • Surrounded by 9 large cities and towns e.g Leeds, Hull, Nottingham (9 million people within 1 hours drive)
Previous Landuse:
Former steelworks. Great location in the early 18th Century due to flat land, water power, coal, millstone grit, limestone, labour all nearby.

However, the steel industry began to decline in Sheffield because of:
cheaper imports, lack of raw materials readily available nearby, lower wages abroad and consolidation of the steel industry. Also Sheffield's central location made it difficult for Sheffield to compete with other steel works closer to markets and the coast (exporting and importing).

What Could Sheffield do after the decline of the Steel Industry?

1. Invest in transport links (railway network)

2. Invest in the road network (M1 motorway nearby)

3. Invest in the local economy

4. Invest in tertiary services like retail e.g. making Sheffield a commercial centre

5. Invest in tourism in the region e.g. Peak District to the south of Sheffield

Reason why this site was chosen for Meadowhall:

1. Brownfield site (previous industry on it - so not taking new greenfield land up)

2. Readily available workforce in nearby suburbs of Sheffield

3. Large area available for expansion

4. Transport access - M1 motorway and main A roads leading out of Sheffield nearby

5. 9 million people live within 1 hours drive (a development like Meadowhall would need lots of people to use it to make it profitable)

Meadowhall Features:
Under 1 roof
Leisure, retail and recreation (shops, cinema, games, restaurants)
Family orientated
300+ shops
Food court (serving fast food and restaurant standard)
12,000 free car park spaces
Wide aisles / flat surfaces
Lifts / mobility services
Safe / secure
Transport Interchange (bus, rail, tram)
30 million people visiting Meadowhall each year

Consider the negative impacts of Meadowhall:
1. 25% drop in trade in Sheffield City Centre when Meadowhall opened

2. Decline of the Sheffield City Centre - shops closed down, bargain shops moved in, graffiti, litter, vandalism, crime increased (becoming the 'Dead Heart' and not the 'Vibrant Hub' it once was.

3. Council had to spend money on regenerating the city centre - pedestrianising, improving transport facilities and diversifying to attract people back to the city

Theme 2: Settlement - General Revision

Settlement

Landuse models
Landuse models are simplified maps showing different land uses within a city.

Patterns of landuse in different cities:
Where is the CBD?
Where are the industrial areas?
Where are the Different types of residential areas?
What are the main features of each land use?

Why do cities grow?
Urbanisation is the increase in the proportion of people living in towns and cities.

MEDCs
MEDCs have high levels of urbanisation. This is because they have industrialised. The movement of people from rural to urban areas followed the industrial revolution when there was a great demand for people to work in the factories that developed.

It took place throughout the 19th and Early 20th Centuries in Europe and North America. By 1950 most of the people in these two continents lived in urban areas. Urbanisation has not slowed in most MEDCs. In fact many large urban areas are now experiencing counter-urbanisation (movement of people out of town and cities). This is happening because:

· People are now more mobile than in the past so they can live further away from work
· Developments such as the fax and Email means more people can work from home

LEDCs
Since 1950 urbanisation has taken place mainly in LEDCs. This is mainly the result of push and pull factors:

Pull
· The greater opportunities to find work
· Better education
· Better health care
· Entertainment

Push
· Drought
· Famine
· Civil war
· Lack of opportunity
· Mechanisation

Shanty Towns/Favelas (Brazil)/Bustees (India)/Barrios (Mexico)
Location:
· The edge of cities in LEDCs (e.g. Rio de Janeiro)
Reason:
· Only area of open space
· Close to industry
Main features:
· Poor living conditions
· High population densities
· Illness and disease are common
· Waste and rubbish is dumped in the streets
· Poverty
· Many people do not have jobs
· Built out of scrap materials e.g. wood, corrugated iron, etc

How can local authorities help?
Self help Schemes – Rochina in Rio de Janeiro:
· Local authorities provide building materials e.g. wood and breeze blocks; local residents provide labour supply
· Local authorities provide basic services (e.g. water, electricity and sewerage system) with the money saved
However, Local Authorities cannot keep up with the levels of rural to urban migration. Also, there is not enough money available for even the basic needs of the millions who have already migrated to these areas.

Million Cities
Urbanisation in LEDCs has led to an increase in million or millionaire cities (cities with a population of +1 million inhabitants.

Migration
Types of migration:

1. Immigration
Moving into another country

2. Emigration
Moving out of a country

3. International
Moving from one country to another

4. Voluntary
Moving by choice

5. Forced
Having to move – reasons could include: war, famine, natural disaster, political asylum

6. Temporary/seasonal
Moving for a short period of time

7. Rural to urban
Moving from the countryside to the city

8. Urban to rural
Moving from the city to the countryside

Push Factors:
This is when people are forced to move.

Pull Factors:
This is when people choose to move.

Landuse
The term land use refers to ‘what the land is used for’. Exam questions, particularly those that are based on using a map, often ask about land use e.g. what is the main landuse in grid square 4156.

Types of land use on OS maps include:
Residential
- housing

Forestry
- trees

Agriculture
- farming

Industry
- factories etc

Leisure/recreation/sport
- golf courses, etc

Theme 2: Settlement - Rio de Janeiro

Case Study 8: Rio de Janeiro (a changing settlement in a LEDC)

Location:
Rio de Janeiro is surrounded by picturesque mountains, coves, and beaches. It is a modern city and home to over 11 million inhabitants. Rio is located just north of the Tropic of Capricorn along the Brazilian Atlantic coast. The relief is characterized by steep hills and mountains. These hills are granite based and lead inland to form the Brazilian Highlands. One of the most famous is the coastal mountain Sugar Loaf, which is the landmark most commonly associated with Rio.

Landuse:
There are three distinct zones in Rio. These are known as the North Zone, the Central Zone and the South Zone. Each has a different land use, economic structure and social structure.

The South Zone:

  • Sandy beaches, beautiful mountains and ocean views
  • The most famous landmarks of Rio, Sugar Loaf Mountain and the statue of Christ the Redeemer, are both here
  • This area is very affluent
  • The area is spread out for several miles, squeezed between the mountains to the north and the coastline to the south
  • The South Zone is one of the most densely populated regions in the world

The Central Zone:

  • The Central Business District
  • Commerce, banking and business.
  • Where the original city of Rio de Janeiro was founded and is now defined by its many skyscrapers.
  • Accessed mostly by car, bus and partly by subway and streetcar.
  • Congestion during rush hour periods and adds to the already severe problem of pollution.
The North Zone:

  • the main port area and centre of industry of Rio.
  • Located north and west of the Central Zone
  • The airport and the main soccer stadium, holding over 200,000, is located here
  • There is a poor inner-city ring between the CBD and the North Zone. Then the wealth increases in another ring further out
  • Economic status drops the further away from the city you go

Migration into Rio:

  • Rio de Janeiro is (and has) experiencing a dramatic increase in population
  • Mostly in the form of the rural poor migrating to the cities
  • Because of the high land values and the enormous demand for space, these poor are forced into squatter settlements known as favelas
  • These settlements usually occur in two areas of Rio: one, along the steep hillsides or, two, along the outer fringes of urban expansion
  • The houses are usually made first from wattle-and-daub, a mixture of sand and clay, and eventually to the use of wood, brick and sheet metal
  • Usually the first settle near the bottom of the hills and as time goes by the hill fills upward
Despite efforts to clear and stop the in migration, people have just kept coming to Rio. As cleared rain forest land becomes un-farmable, farmers give up and move to the city. Despite being marginalized and blamed for all kinds of Rio's social problems, the 'Faveladors' have created a society based on cooperation to survive and have found a niche in the overpopulated city. Recently, the populations in the favelas has levelled off. Much of this is due to the lack of available land and the clearing of favela settlements. Despite this, the migration to the city still continues. In many ways, Rio does not wish to acknowledge the existence of the favelas and would rather passively ignores them instead. By doing this the problem only gets worse and the Faveladors are still subject to marginalization.

Rio:
11 million people. Overcrowded. Surrounded by sea and mountains. Congestion. Pollution. Noise. Middle class moving out of Rio looking for safety and security. Authorities are trying to improve Favelas by re-building, re-housing residents. Authorities are trying to encourage community to have faith in Police.
Rocinha:
100,000 people. Built on the hillside overlooking Rio. One of a number of Favelas (shanty towns). Self contained. Shops, schools and facilities. Migrants arrive and build homes from scrap and waste. Constant DIY taking place. Crime is an issue.
Barra:
Middle class moving out of the South Zone of Rio. New settlement. Shops, offices and employment opportunities. Transport (roads/motorways/public transport). Safety and security. Room for expansion and growth.

Theme 2: Settlement - London Docklands

London Docklands – Urban Redevelopment / Renewal

LOCATION:
East End of London – 12 mile stretch downstream, includes Tower Hamlets, Greenwich, Newham and Southwark


CAUSES OF DECLINE IN THE LONDON DOCKLANDS:
The increasing size of ships meant they found it difficult to come as far down the River Thames as the Isle of Dogs (The position of the docks moved further downstream e.g. Tilbury)
Manufacturing declined and many portside industries closed.
Tower blocks / low quality housing built in the 1950s and 1960s to replace the housing damaged during the Second World War.
Containerization meant fewer dockers were needed as cranes were used to lift containers from the ships

PROBLEMS IN THE LONDON DOCKLANDS IN THE 1980s
- Shopping – many small stores / corner shops – no modern shopping centres
- Industry – over half of Docklands was derelict – many empty factories / warehouses – the docks themselves were unused
- Housing – mainly high density – terraced houses – up to 100 yrs old – Houses were small – lacked modern amenities. But there was a strong “East Enders” community spirit
- Transport – narrow congested roads – many heavy lorries – parking a problem
- Employment – decline of industries resulting in loss of jobs & high unemployment
- Open Space – virtually none – almost all land developed – few leisure amenities


WHO HAS BEEN INVOLVED IN HELPING WITH THE REGENERATION PROCESS?

• Local Housing Association – obtained home improvement grants
• LDDC (London Docklands Development Corporation) – responsible for planning and redevelopment of the Docklands area.
• National Government – created Isle of Dogs enterprise zone – offering financial help and reduced rates
• Property Developers – built large office blocks – e.g. Canary Wharf
• Conservation Groups – created schemes to improve the environment
• Newham Council – built low-cost housing / upgraded properties.


Theme 2: Settlement Quick Questions

Quick Questions: Settlement

1. What is urbanisation?

2. How does the rate of urbanisation differ between MEDCs and LEDCs?

3. What is rural-urban migration?

4. Give two push factors and two pull factors that help explain why rural-urban migration happens.

5. Explain what a squatter settlement is.

6. List two consequences of urbanisation in rural areas.

7. Describe two ways in which governments try to manage the problems of urbanisation.

8. a) Give an example of a country you have studied where urbanisation is taking place.

b) Give two push factors that cause urbanisation in that country.

c) Give two pull factors that cause urbanisation in that country.

9. What is counter-urbanisation?

10. Give three impacts of counter-urbanisation in rural areas.

11. How do governments try to manage the impacts of counter-urbanisation?

12. Name the four main parts of a city.

13. Which of the four parts of the city is furthest from the centre?

14. Which part of a city mainly has medium-class housing?

15. Describe the social, economic and cultural factors that have led to business parks and high-class housing being built in the rural-urban fringe.

16. List one social, one economic and one environmental need the population of a growing city may have.

17. What does sustainable mean?

18. Describe two types of sustainable urban development.

19. a) Name a city you have studied that is undergoing development.

b) Give one economic and one social aim of the development.

c) Describe how sustainable the development project is.

20. What are low order goods?

21. What is the threshold population for a shop?

22. Describe the goods sold, threshold population, sphere of influence and accessibility for shops in the following areas:

a) CBD,

b) Rural-urban fringe.

23. What are the two main factors that have changed the way we shop in the UK in the last 100 years?

24. Describe how retail services in a named area have changed and what effects this has had on the surrounding area.

Friday, 16 January 2009

Theme 3: Nat Haz (Climatic) - General Revision

Tropical Storms

Names
Tropical storms are also known as:


Hurricanes = North Atlantic
Typhoons = Pacific
Tropical Cyclones = South East Asia
Willy-Willies = Australia

Conditions required for formation:

· Over Oceans
· Ocean temperature over 27°c
· Water heated to a depth of several metres
· Close to the East Coast of continents
· Late summer or early Autumn, when sea temperatures are at their highest (notice how hurricanes always hit America around September/October!)

Causes of tropical storms
· Air on surface of ocean is heated (it also contains lots of moisture)
· Hot, humid air rises, cools and condenses. Clouds form.
· Rising air creates low pressure. Air rushes in to fill gap left by rising air.
· Rotation of the earth means winds do not blow straight. Winds circle towards the centre.
· The storm continues to feed itself.
· Whole system moves westwards towards land.
· When the system crosses the land it losses its source of heat and moisture. The tropical storm losses its energy and dies out.

Managing the effects of tropical storms
Reducing the effects of tropical storms includes:
· Studying tropical storms once they form
· Providing an early warning system
· Long-term planning in areas prone to tropical storms

Theme 3: Nat Haz - Tropical Storms